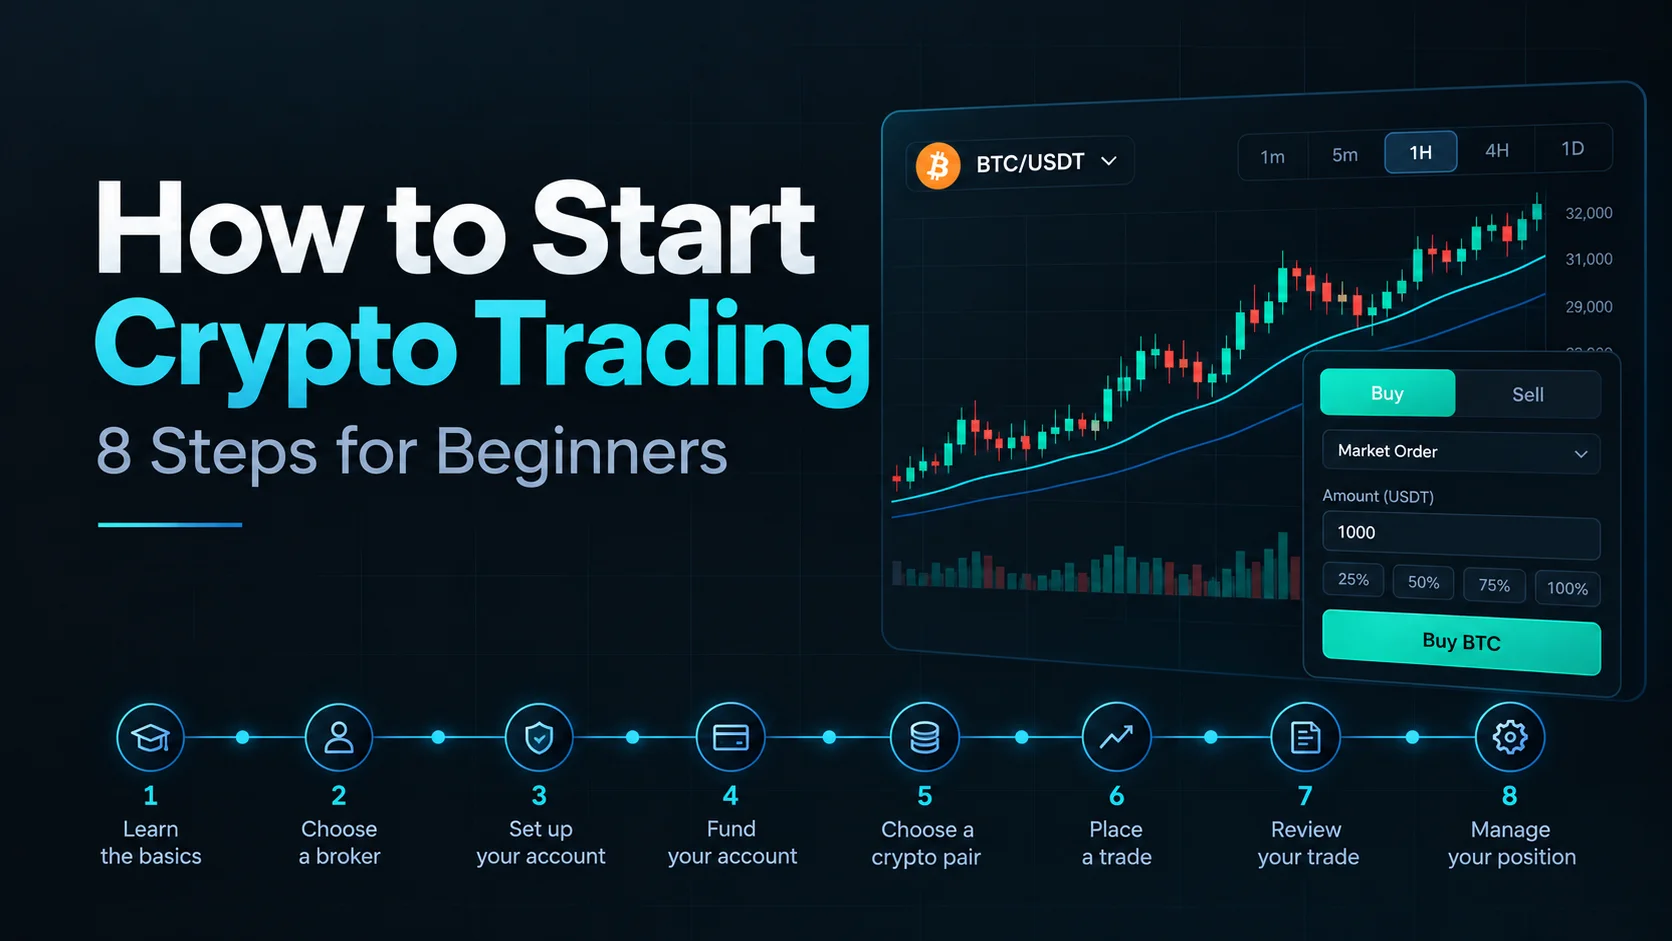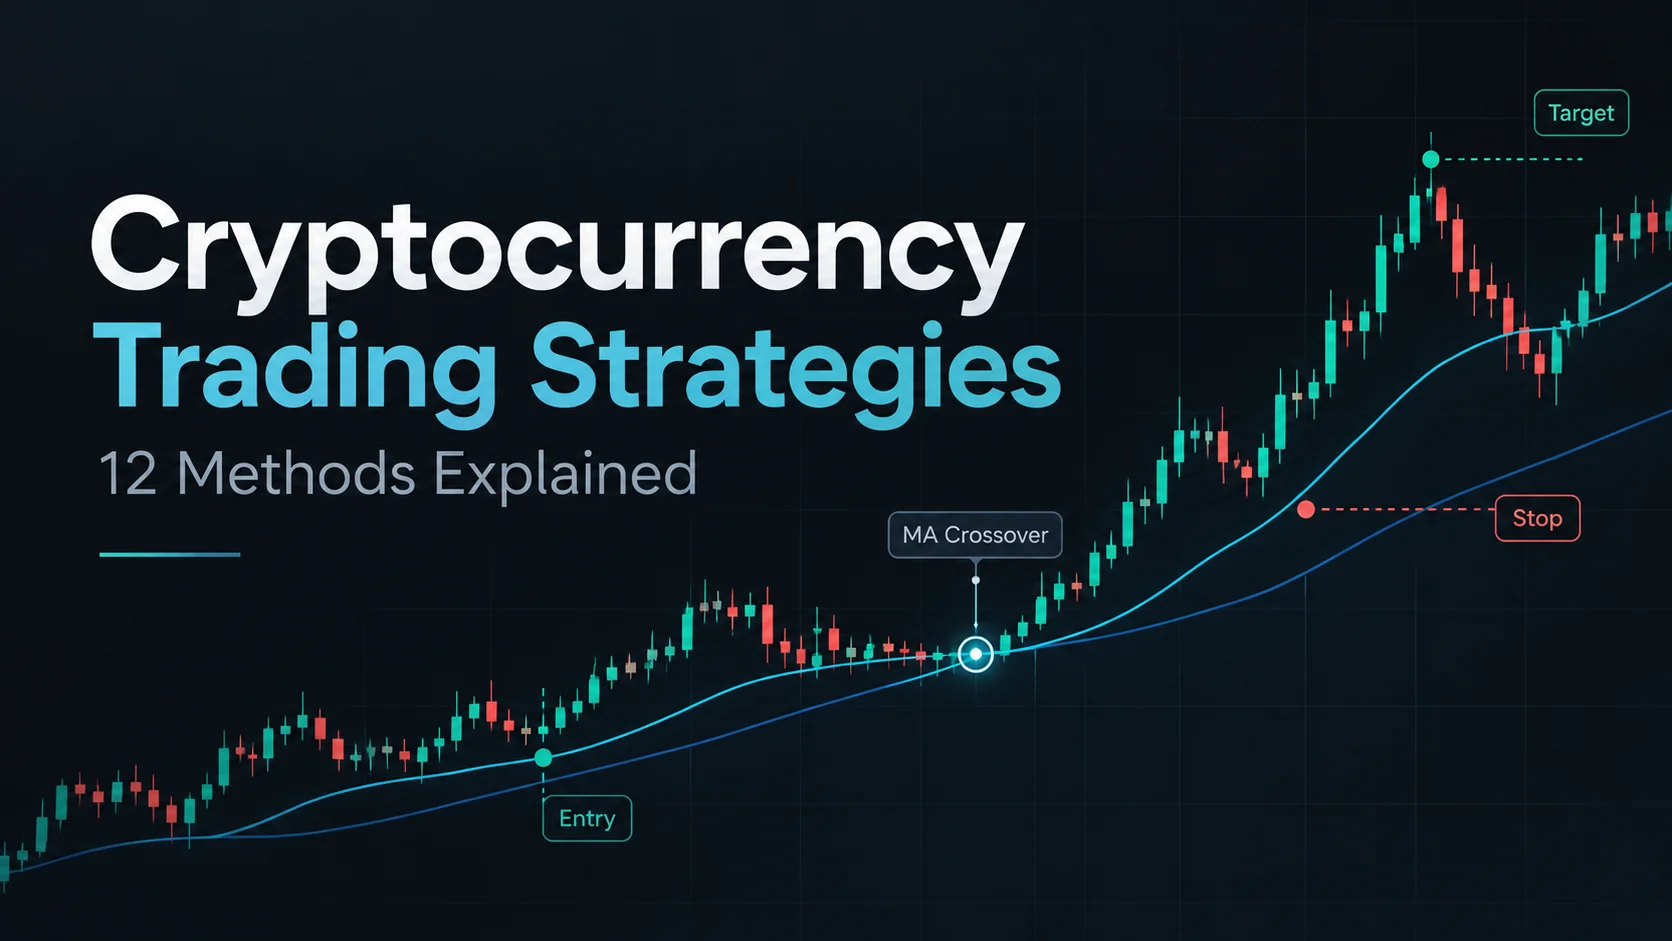
Cryptocurrency trading strategies establish clear rules for buying, selling, and holding digital assets. A complete strategy defines the market, entry and exit conditions, position size, and acceptable risk. The main approaches include swing trading, day trading, trend following, and arbitrage. Dollar-cost averaging and buy and hold serve longer-term investors. Every approach carries the possibility of loss.
This article examines 12 approaches, identifies the conditions in which each is useful, and explains how to test a trading plan before committing capital. It primarily addresses U.S. readers, with a separate note on UK taxation. Market access, investor protections, and tax treatment vary by jurisdiction. All prices and trading scenarios are illustrative rather than live market signals.
Risk warning: Cryptoassets can lose most or all of their value. Leverage, thin liquidity, fraud, and custody failures increase the risk of substantial losses. This material is educational and does not constitute personalized investment, tax, or legal advice.
What is a cryptocurrency trading strategy?
A cryptocurrency trading strategy is a repeatable framework for making decisions. It identifies what to trade, the conditions that justify an entry, the level or event that invalidates the idea, the method for exiting, and the amount of capital at risk. A market forecast without these rules is speculation, not a complete trading plan.
A trading style describes the holding period, from seconds to years. A trading signal identifies a condition for potential action, such as a breakout above resistance. An indicator, including the relative strength index (RSI), supplies information used to assess that condition. An order type determines how an exchange processes the instruction. Each serves a different purpose within a trading strategy.
Consider a swing trader who follows a trend, uses an exponential moving average to assess direction, and places a limit order to enter. Those elements form one coherent plan, not three distinct strategies. The strength of the plan lies in defined, testable rules and consistent execution—not in the number of indicators it uses.
Key takeaways
- No universally best strategy exists. Results depend on market conditions, execution costs, discipline, and the rules used.
- Activity is not the same as skill. Frequent trading increases demands on attention, execution, and recordkeeping.
- DCA and HODL are investing approaches. They belong in a broad comparison but should not be confused with short-term trading systems.
- Risk control comes before entry signals. Define what could invalidate a trade and what loss is tolerable before placing it.
Crypto trading strategies at a glance
The comparison below organizes 12 strategies by holding period, monitoring demands, principal challenges, and conditions that undermine their effectiveness. These categories overlap. Trend following, for example, works as a framework across intraday, swing, and longer-term trading.
| Strategy | Typical horizon | Monitoring | Main challenge | When to avoid it |
|---|---|---|---|---|
| Buy and hold (HODL) | Months to years | Low | Long drawdowns and custody | When the investment thesis or loss capacity is unclear |
| Dollar-cost averaging | Regular purchases over time | Low | Continuing to buy a declining asset | When recurring investment is unaffordable |
| Position trading | Weeks to months | Moderate | Large price swings before the thesis resolves | When long-duration exposure is unacceptable |
| Swing trading | Days to weeks | Moderate | Sudden moves while positions are open | When entries and exits cannot be monitored |
| Trend following | Variable | Moderate | False signals in choppy markets | When price has no sustained direction |
| Day trading | Within a trading session | High | Fees, slippage, rapid decisions | When screen time or experience is limited |
| Scalping | Seconds to minutes | Very high | Trading costs can erase tiny gains | When liquidity or execution quality is poor |
| Range / mean reversion | Minutes to weeks | Moderate to high | A range can break decisively | When a strong new trend begins |
| Breakout / momentum | Minutes to days | High | False breakouts and reversals | When breakouts lack credible confirmation |
| Event-driven | Minutes to days | High | Information is priced in quickly | When the source or liquidity is unreliable |
| Arbitrage / pairs trading | Variable | High; often technical | Execution, funding, and model risks | Without access, infrastructure, and cost modelling |
| Grid trading | Variable | Periodic oversight | Inventory losses in a one-way move | When price leaves the configured range |
How to use this table: Start with the time available for monitoring positions and the level of loss you can afford. Compare those limits with each strategy's requirements and failure conditions. Complexity and trading frequency do not determine profitability.
How crypto trading strategies are classified
Active trading vs. passive investing
Active trading involves repeated entries, exits, or adjustments to exploit price movements. Scalping, day trading, and most swing-trading systems fall into this category. Success demands a repeatable method, disciplined execution, adequate attention, and careful control of cumulative costs.
Passive investing relies on fewer transactions and a longer holding period. Buy and hold and dollar-cost averaging are familiar examples. Lower activity reduces execution demands, but it does not reduce the inherent volatility of the asset. A long-term position can still suffer a permanent loss.
Timeframe, market condition, and instrument
Strategies can also be classified by the market behavior they target. Trend following captures sustained directional movement. Range and mean-reversion methods seek a return toward an established level. Breakout strategies respond when price escapes a defined area. The instrument matters as well: spot ownership and derivatives exposure introduce different costs, obligations, and risks. A single approach can operate across several timeframes and instruments.
12 cryptocurrency trading strategies explained
1. Buy and hold (HODL)
How it works: Buy and hold means purchasing a cryptoasset on the strength of a long-term investment thesis and retaining it through short-term fluctuations. The position is reviewed against the original thesis rather than traded on every chart movement. Holding for the long term does not mean ignoring changes in the asset's fundamentals.
Example: An investor expects a blockchain network to retain economic relevance over several years. They establish a limited position, record the reasons for investing, and review adoption, network security, competition, and financial needs every quarter. Those reviews determine whether to retain, reduce, or close the position.
Key risks: Extended drawdowns, project failure, declining liquidity, and custody mistakes can destroy investment value. Owning several cryptoassets offers limited protection when their prices fall together. Buy and hold is an investment approach, not an automatic source of returns or a short-term trading advantage.
2. Dollar-cost averaging (DCA)
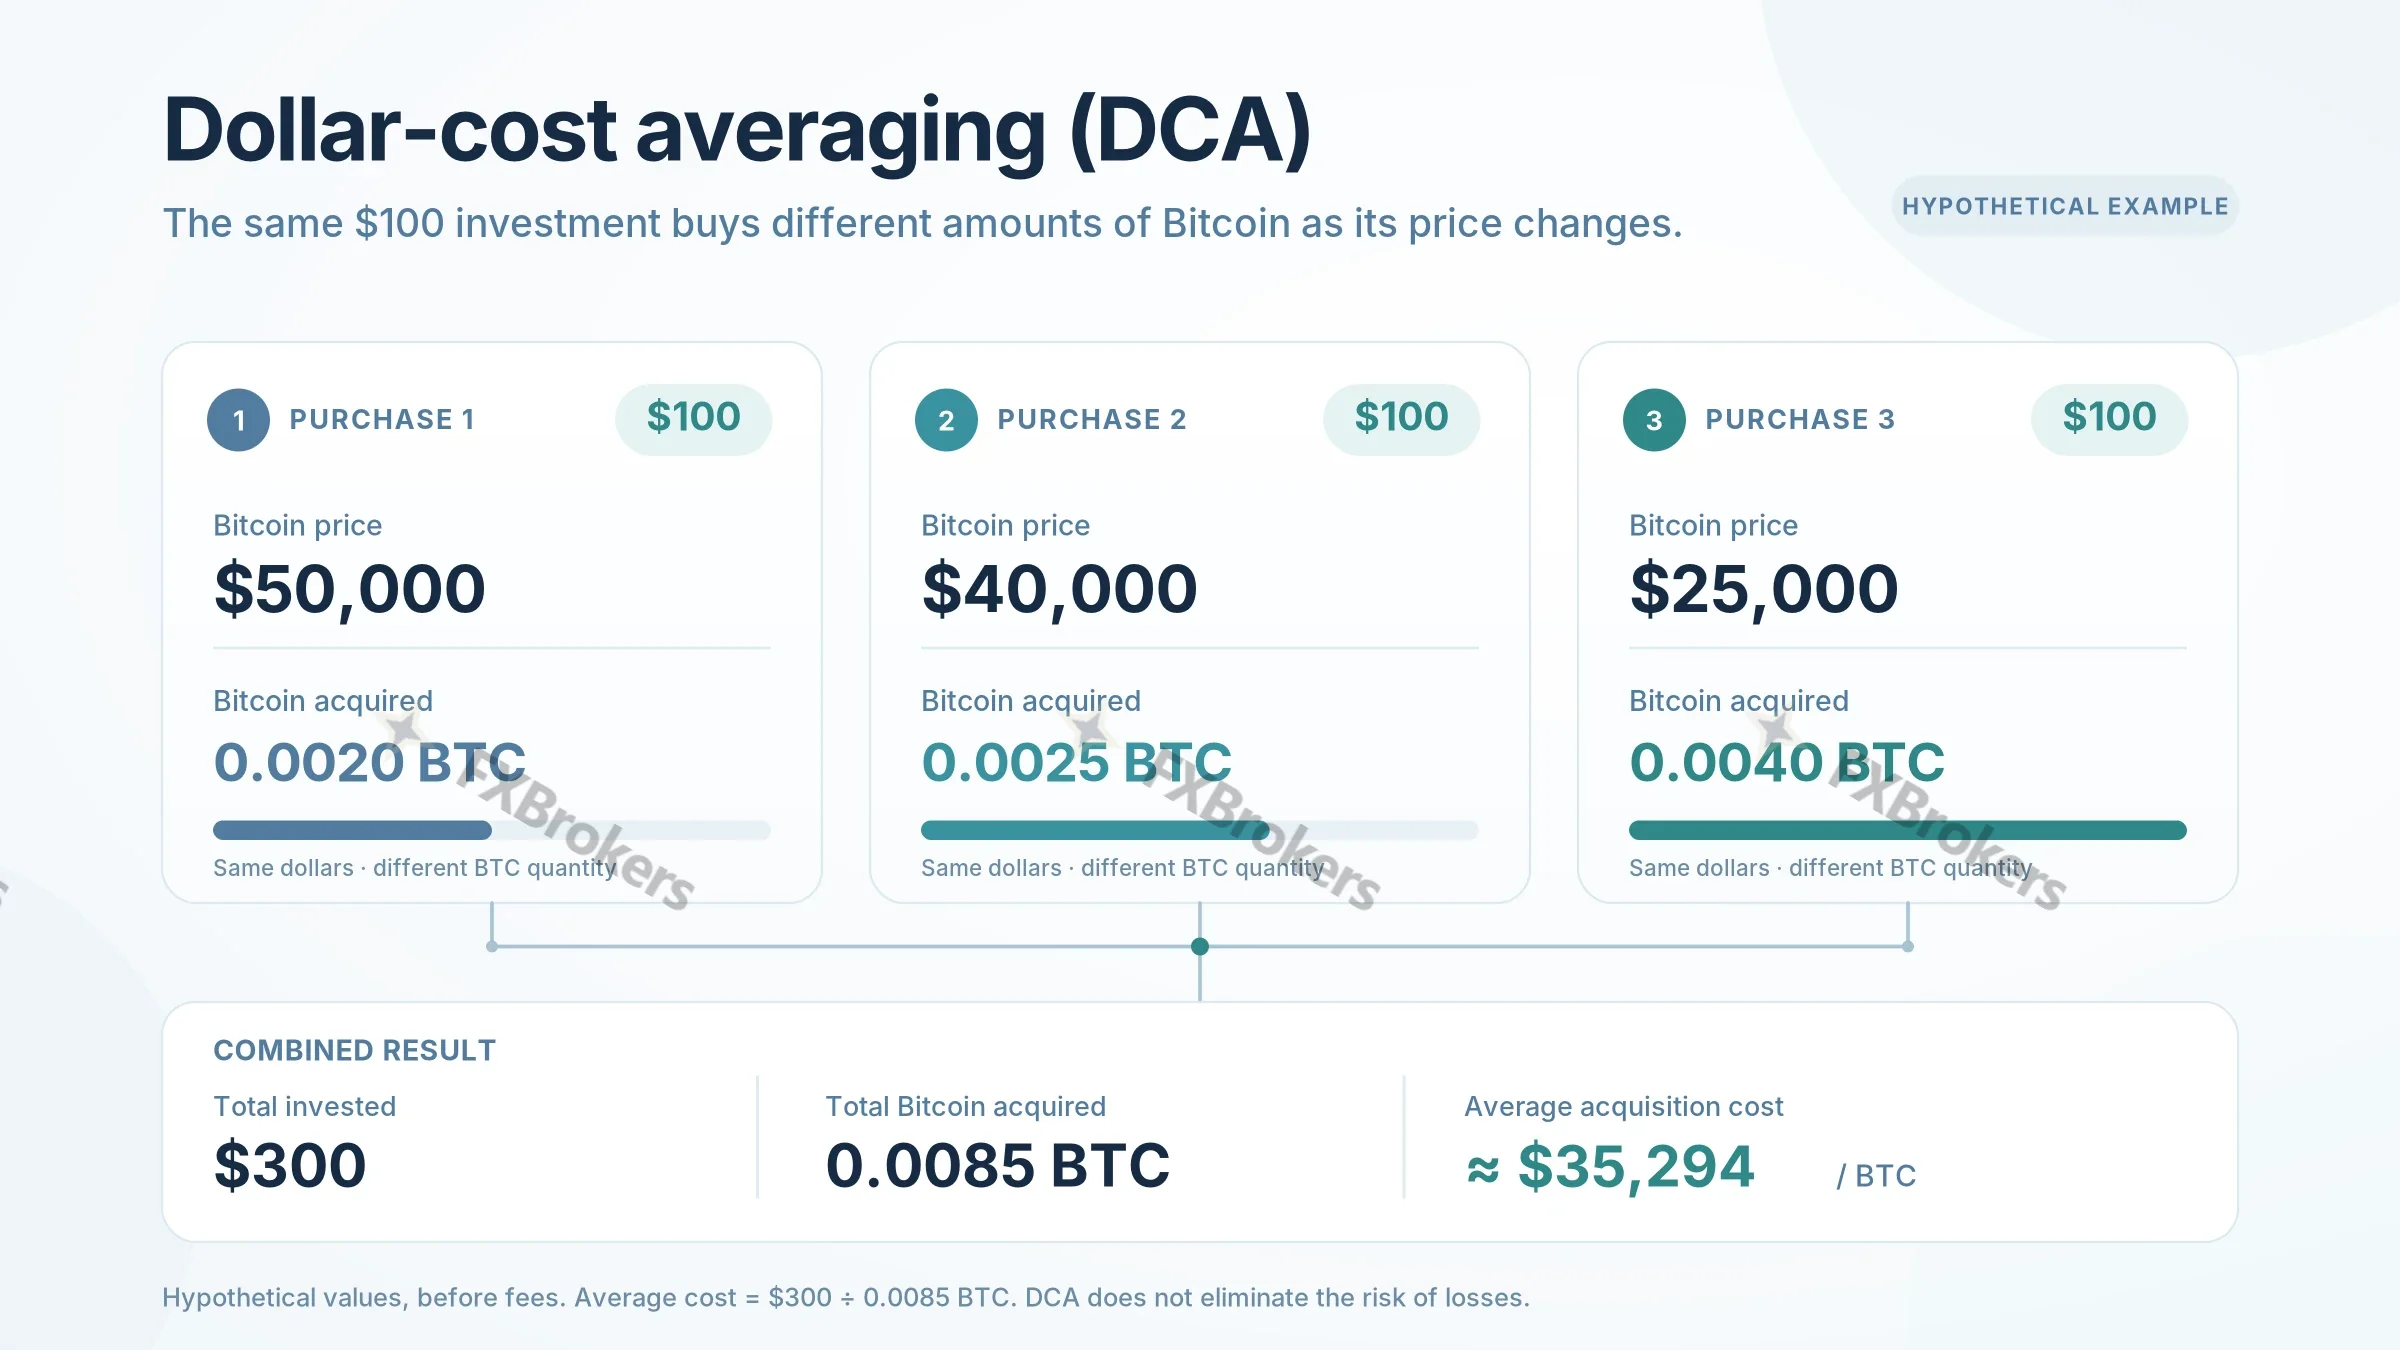
How it works: Dollar-cost averaging (DCA) invests a fixed amount at regular intervals, regardless of the market price. The same amount buys more units when prices are low and fewer when prices are high. The approach replaces the need to choose a single entry date with a predetermined purchase schedule.
| Purchase | BTC price | Amount invested | BTC acquired |
|---|---|---|---|
| 1 | $50,000 | $100 | 0.0020 BTC |
| 2 | $40,000 | $100 | 0.0025 BTC |
| 3 | $25,000 | $100 | 0.0040 BTC |
| Total | — | $300 | 0.0085 BTC |
At an ending BTC price of $25,000, the 0.0085 BTC accumulated in this example is worth $212.50. Against $300 invested, that represents an unrealized loss of $87.50, or about 29.2%, before fees. DCA distributes entry timing; it does not protect capital against a sustained decline or consistently outperform a lump-sum purchase. It requires a long-term rationale and an affordable contribution schedule.
3. Position trading
How it works: Position trading holds a directional trade for weeks or months. Traders work from a broad market thesis, then establish specific conditions for entry, increasing or reducing exposure, and closing the position. Unlike passive holding, the trade depends on a defined market setup and a clear invalidation rule.
Example: A position trader identifies a sustained uptrend, improving participation, and a price area offering a defensible entry. The position remains open while the underlying conditions persist and closes when the predefined invalidation condition is reached. The exit follows the strategy rather than a change in mood.
Key risks: Large price swings, trend reversals, and sudden weekend movements can produce substantial losses. Extending the holding period does not rescue a failed short-term trade. Position trading requires capital that is not needed immediately and an exit plan established in advance.
4. Swing trading
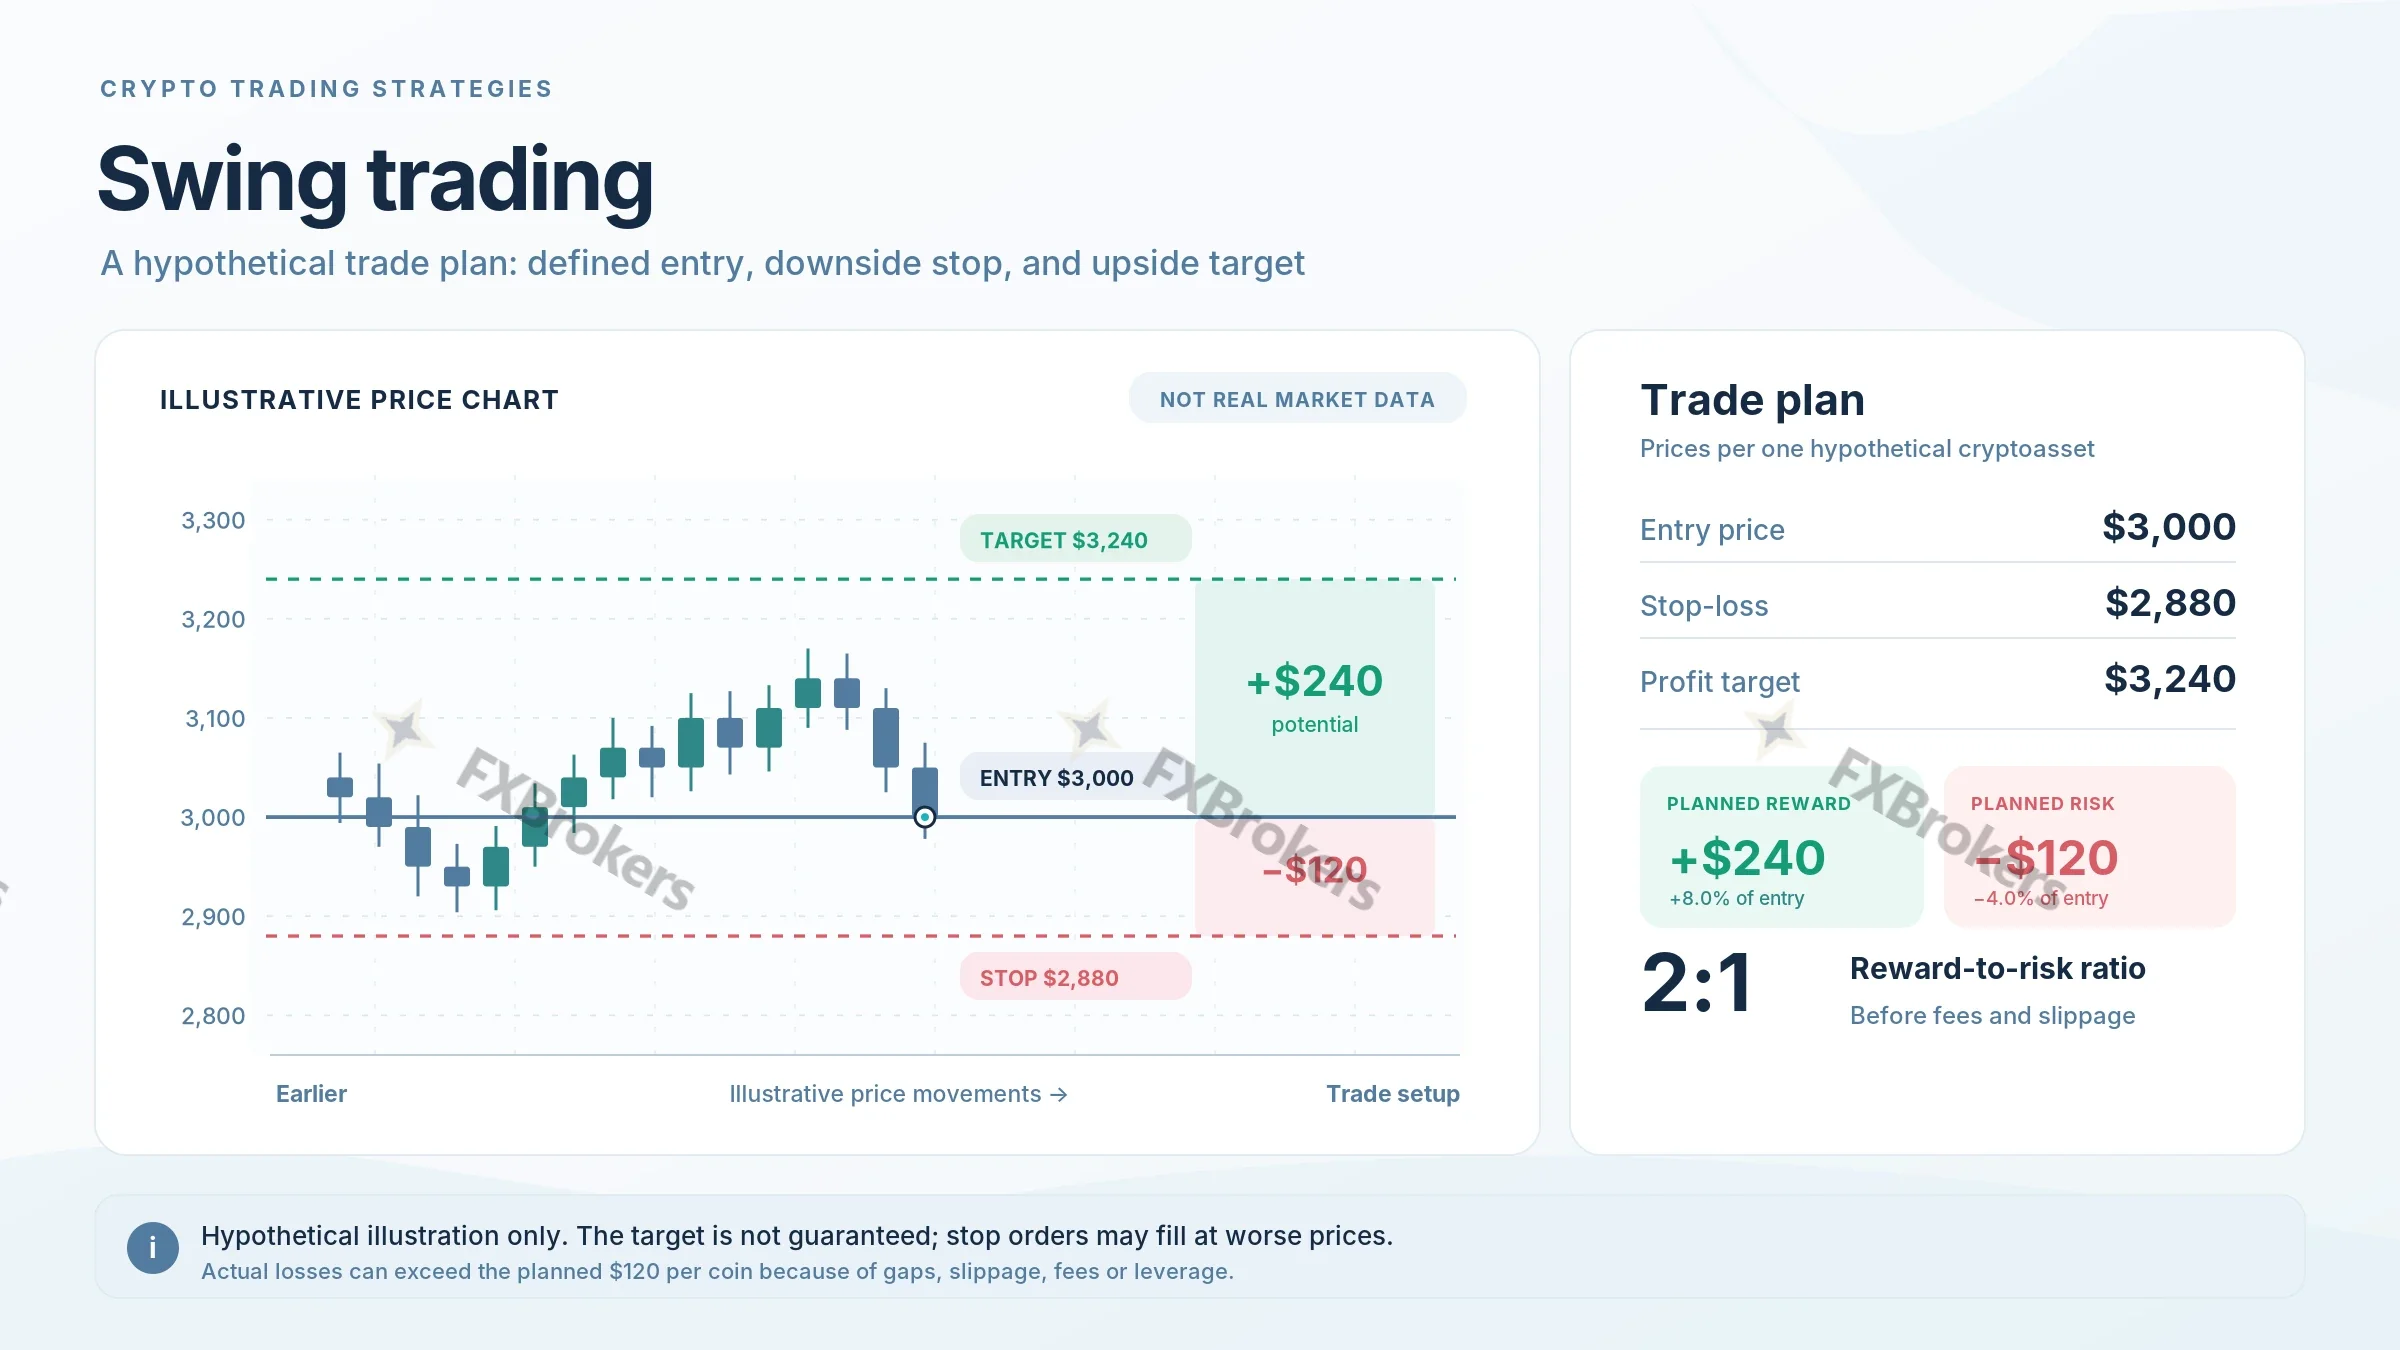
How it works: Swing trading targets price moves that develop over days or weeks. A typical process identifies the prevailing trend, waits for a pullback or consolidation, and sets entry, invalidation, and profit-taking levels before the trade begins.
Hypothetical setup: A coin trades around $3,000 after a pullback. The plan specifies an entry at $3,000, a stop reference at $2,880, and a profit target at $3,240. The planned downside is $120 per coin and the potential upside is $240, producing a 2:1 reward-to-risk ratio before fees, slippage, or price gaps. This ratio describes the setup; it does not establish the probability of reaching the target.
Key risks: Overnight developments, weekend price changes, shallow order books, and stop-order slippage can turn a carefully planned trade into a larger loss. Swing trading demands less continuous screen time than scalping, but every open position remains exposed between monitoring sessions.
5. Trend following
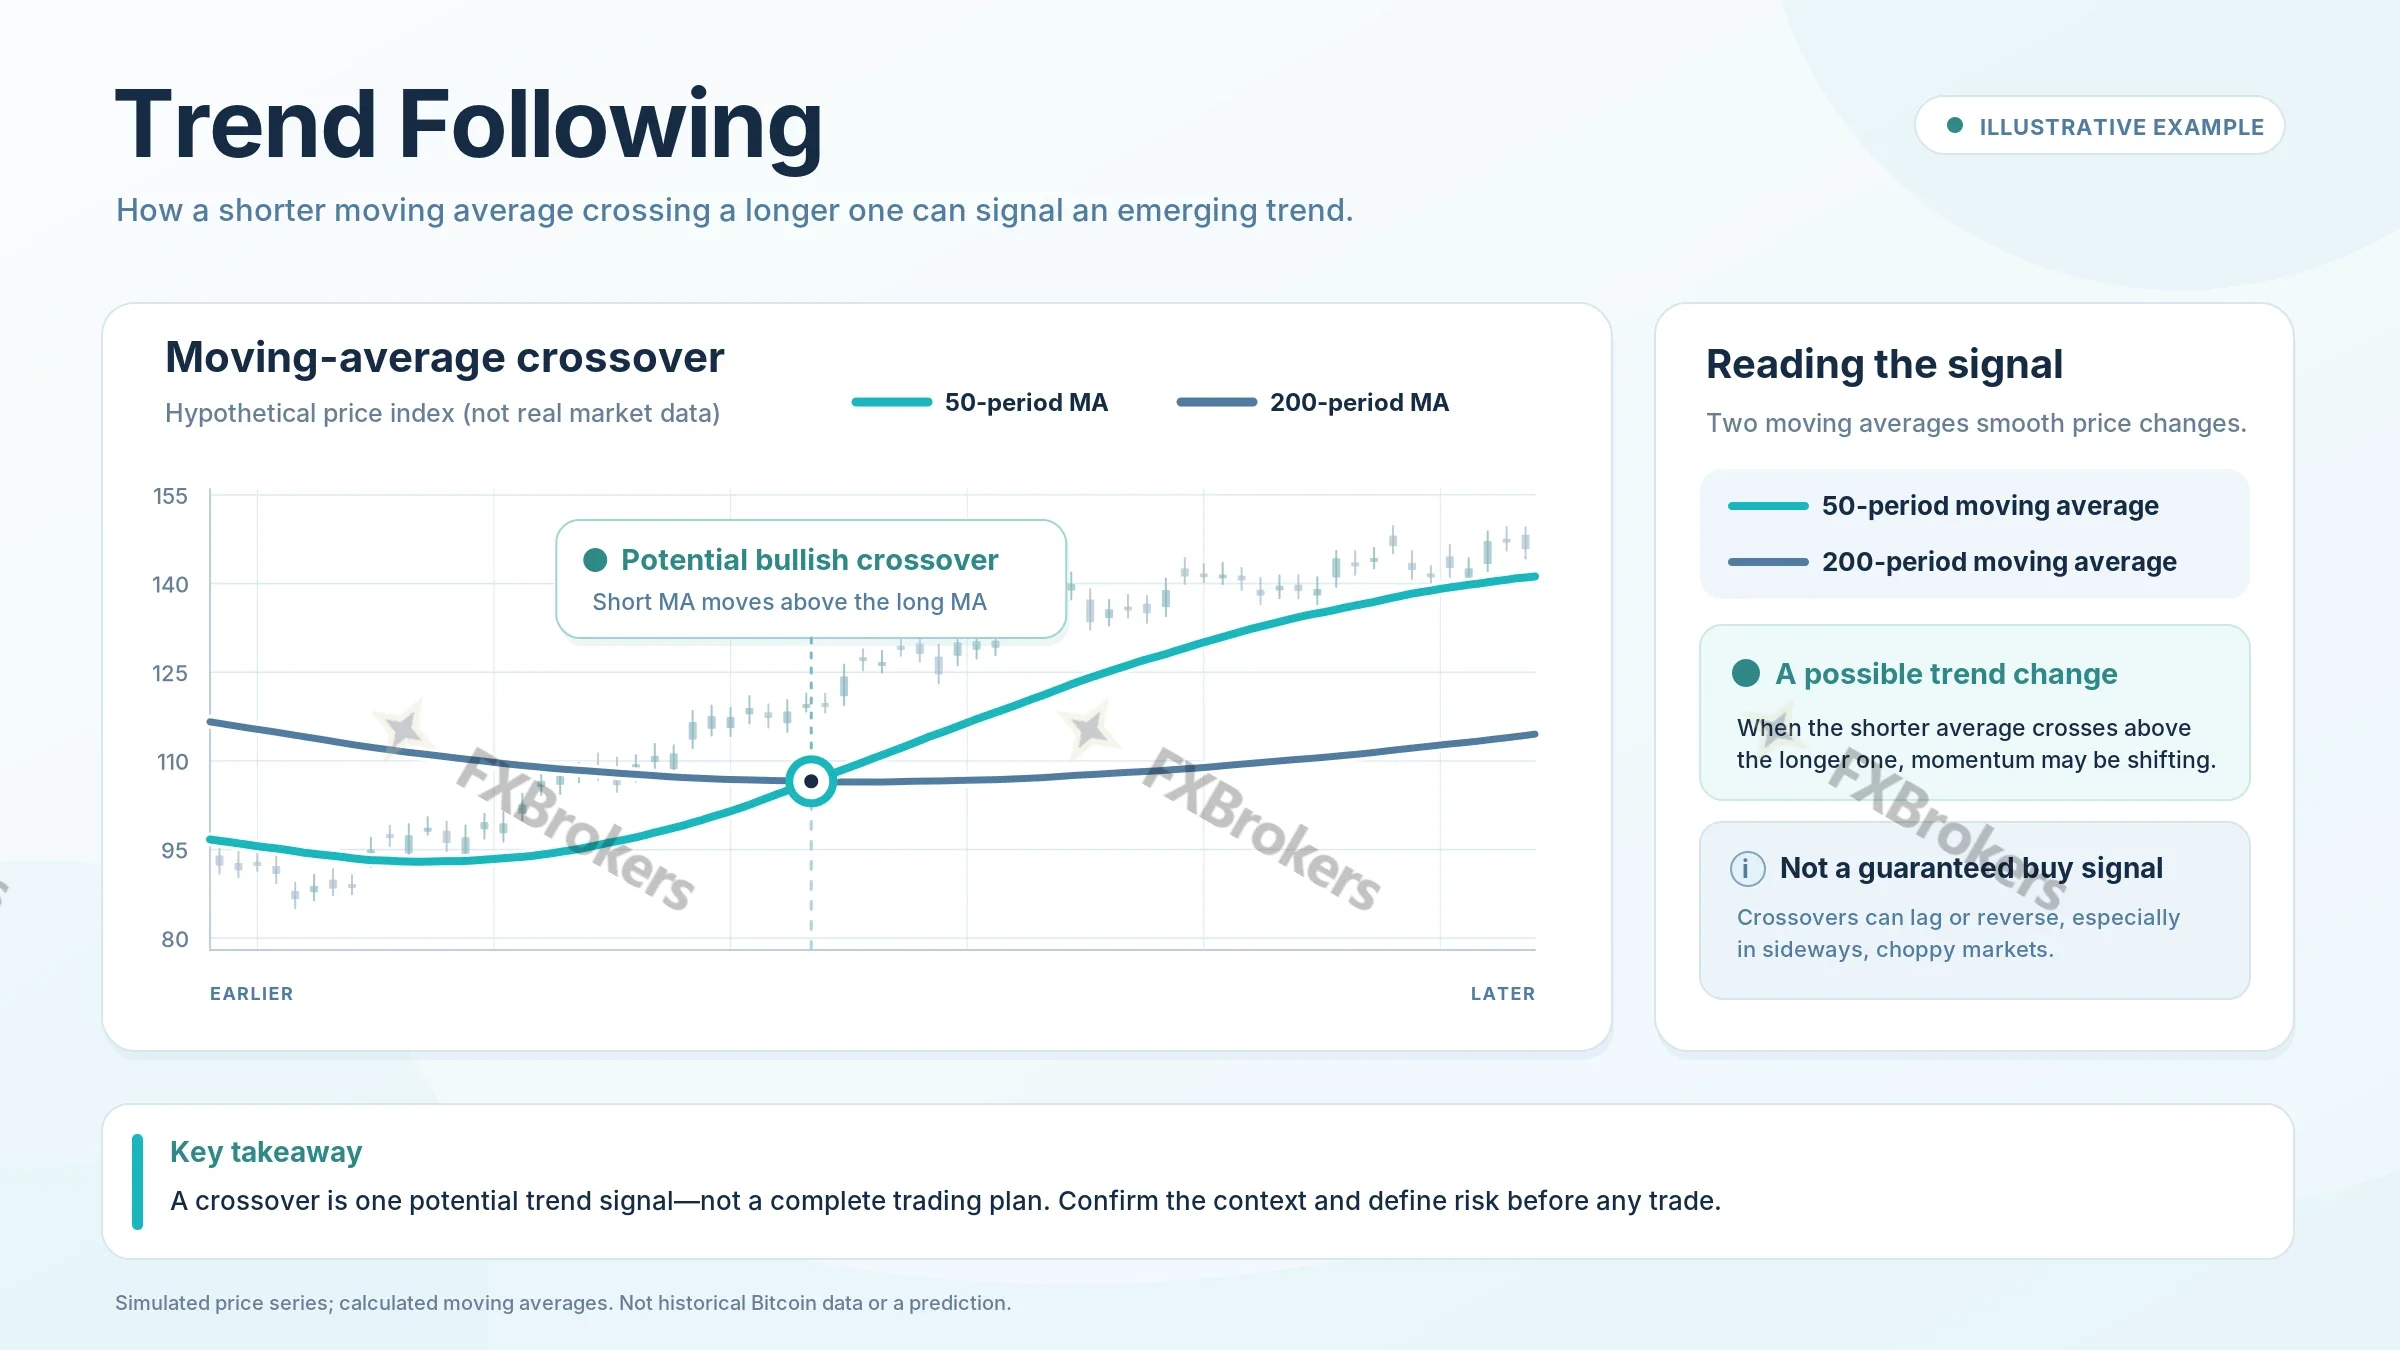
How it works: Trend following seeks to participate in an established price direction rather than predict its turning points. One straightforward model compares shorter- and longer-period moving averages, then enters only when separate price and risk conditions confirm the trade.
What confirmation means: A moving-average crossover is an input, not a full strategy. The plan must state the chart timeframe, whether the signal requires a closing price, where the trade is invalidated, and how position size is calculated. Volume and market structure provide additional context, but neither turns a signal into a certainty.
Key risks: Moving averages lag behind price, which can delay entries and exits. Sideways markets often trigger repeated reversals known as whipsaws, generating a sequence of small losses. Trend following belongs within a broader trading style, whether intraday, swing, or position trading.
6. Day trading
How it works: Day trading seeks opportunities in intraday price movement and normally closes positions within a chosen trading session. Cryptocurrency markets often operate continuously, so the trader defines a personal session, liquidity requirements, and an end-of-session exit policy.
Example: A day trader monitors a liquid pair during a fixed two-hour period. After identifying an intraday range, the trader acts only at a predetermined level and only when available liquidity meets the plan's requirements. The order includes a loss budget and exit rule that account for spreads, fees, and possible slippage.
Key risks: Rapid decisions, repeated commissions, and poor fills can erode performance. A strategy can win more often than it loses and still be unprofitable when the average loss exceeds the average gain. Day trading should be tested in simulation with realistic execution costs before any capital is committed.
7. Scalping
How it works: Scalping attempts to capture numerous small price moves over seconds or minutes. It can be discretionary or automated, but in either case it depends on tight spreads, deep liquidity, fast execution, and immediate control of unsuccessful trades.
Why costs matter: Suppose a trade captures a gross movement of 0.30%. Combined entry and exit fees total 0.20% of notional value, while spread and slippage add another 0.10%. The entire theoretical gain disappears before other expenses. With such small targets, the quality of execution can determine the outcome.
Key risks: Sudden volatility, order delays, widening spreads, and decision fatigue can quickly overwhelm small expected gains. Scalping requires precise cost analysis and reliable execution data. Without those capabilities, it is a poor fit.
8. Range trading and mean reversion
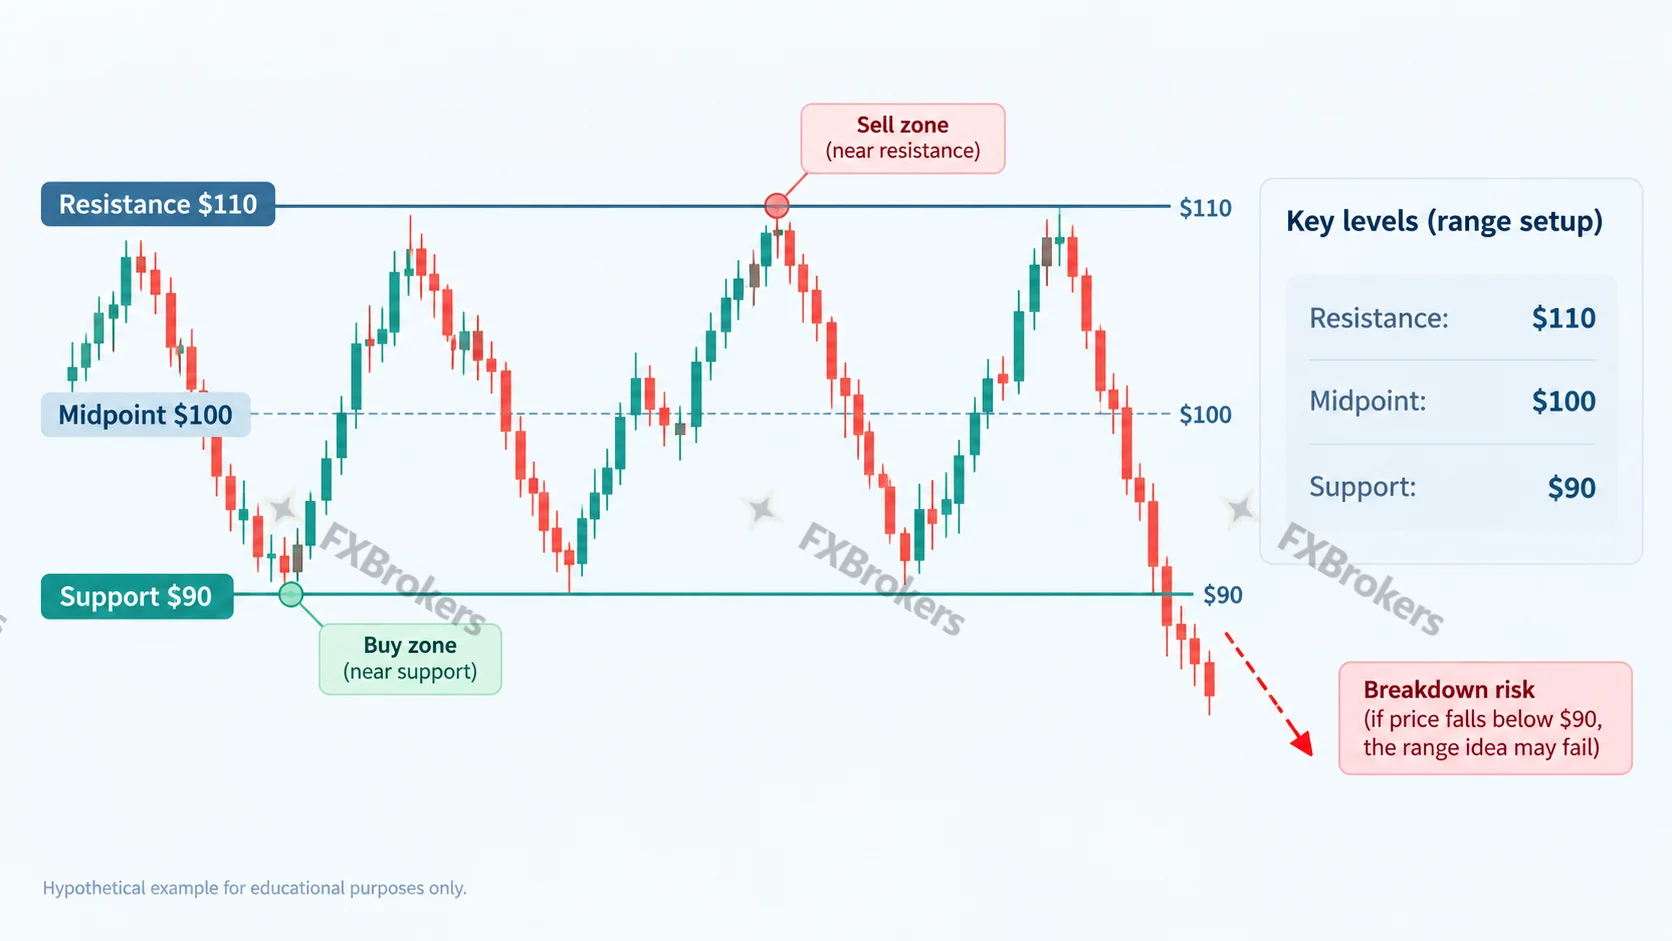
How it works: Range trading targets repeated movement between established support and resistance zones. Mean reversion is broader: it assumes that an unusually stretched price or price relationship will move back toward a reference level. Both depend on the market maintaining the behavior on which the setup is built.
Hypothetical setup: A coin has repeatedly traded between $90 and $110. A range trader looks for a qualified entry near the lower zone and an exit closer to the upper zone, while defining a breakdown level that invalidates the setup. The existence of a historical range alone is not sufficient reason to enter.
Key risks: Support does not prevent a further decline, and resistance does not prevent a rally. Once the range breaks, repeated attempts to trade the old boundaries can compound losses. The strategy becomes vulnerable when a sideways market develops a strong directional trend.
9. Breakout and momentum trading
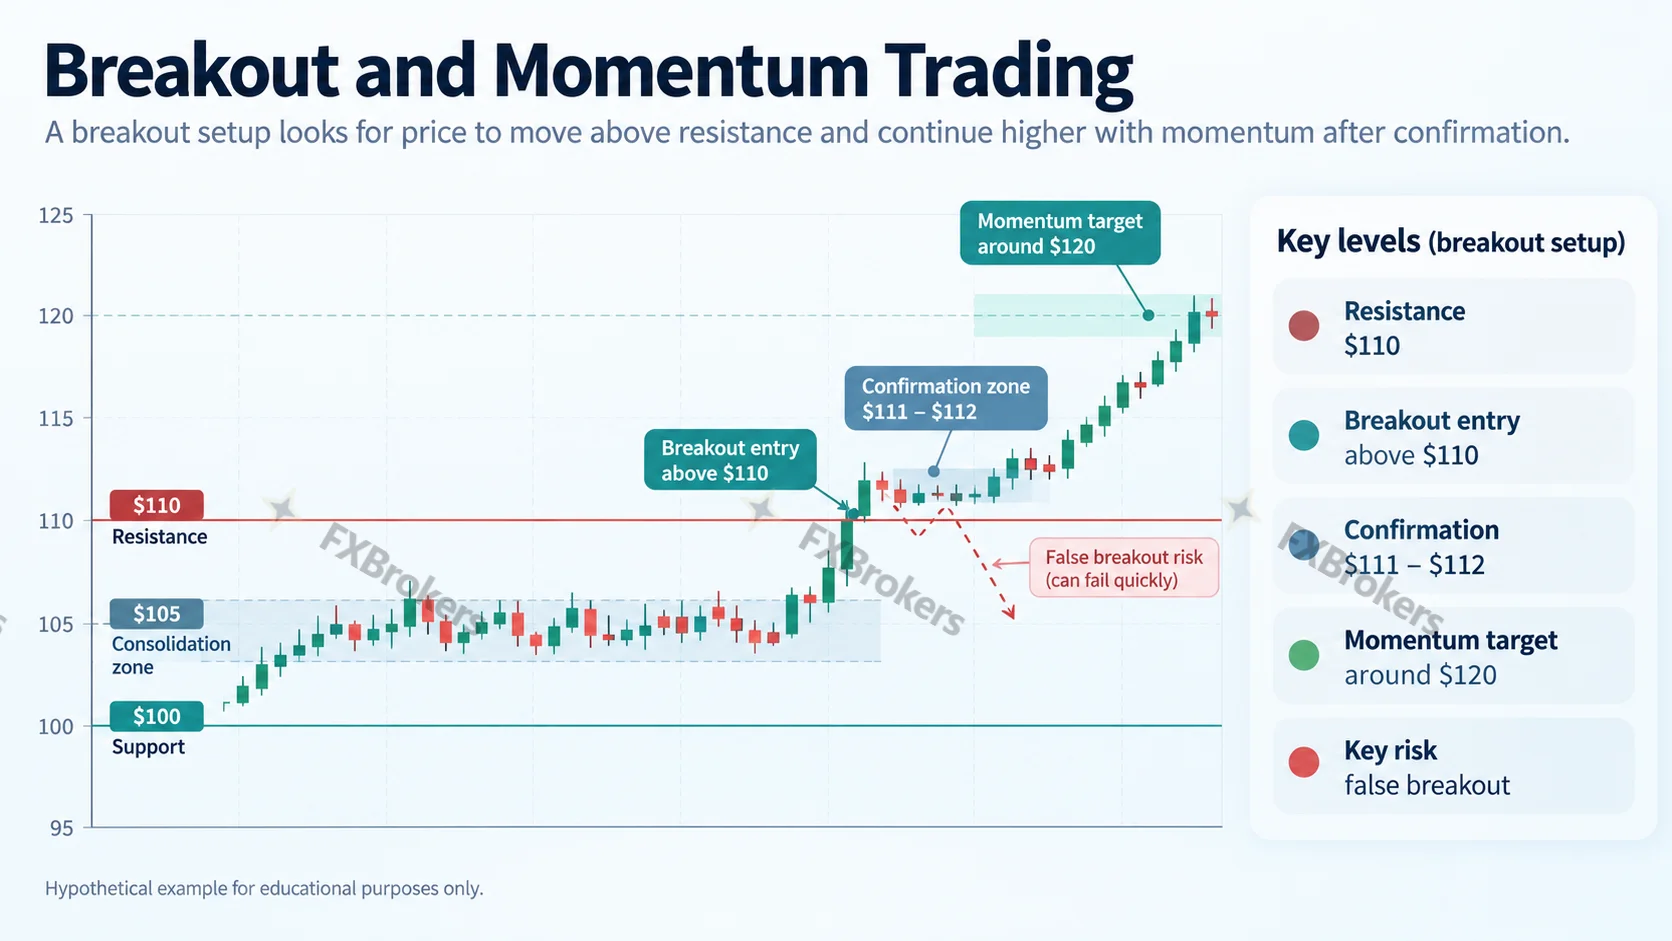
How it works: Breakout trading responds when price moves beyond an established level. Momentum trading focuses on the force and persistence of that movement. A robust setup evaluates the breakout, participation, liquidity, and distance to the point at which the trade thesis fails.
Example: A coin repeatedly encounters selling pressure near $100. A brief print at $101 does not establish a durable breakout. The trading plan instead requires confirmation over the selected timeframe and specifies an exit if price moves back inside the previous range.
Key risks: False breakouts can reverse sharply, particularly when market depth is thin. Traders also risk entering after the strongest part of a move has passed. A single candle or an unverified social-media claim is not a sufficient basis for a momentum trade.
10. News and event-driven trading
How it works: Event-driven trading responds to information capable of changing market expectations: protocol upgrades, exchange listings, security incidents, regulatory decisions, or economic announcements. The essential task is to distinguish genuinely new information from developments already reflected in the price.
Example: Following an announced network upgrade, a trader checks the primary announcement, evaluates its effect on functionality and risk, and waits for the predefined market setup. The announcement supplies context; the trading rules determine whether a position is justified.
Key risks: False reports, delays, thin liquidity, and abrupt volatility make event-driven trades difficult to execute. Prices also fall on apparently favorable news when expectations were already elevated. Unverified tips and promises of guaranteed listing gains deserve no weight in a disciplined trading process.
11. Arbitrage and pairs trading
How arbitrage works: An asset trades at $100 on one exchange and $101 on another. The visible $1 difference is only a potential gross spread. Trading and transfer fees, withdrawal limits, execution delays, available quantities, and slippage determine whether any profit remains. Both sides of the trade must be executable.
How pairs trading differs: Pairs trading models a relationship between two assets and takes positions when their relative prices depart from that model. The method depends on the relationship remaining stable enough to support convergence. When market structure changes, a divergence can persist or widen.
Pairs-trading models are often evaluated through historical simulations. A favorable backtest, including one built on cointegration or more complex dependence models, shows how a specific model performed on specific data. It does not establish a dependable profit opportunity in future market conditions.
Key risks: Execution mismatches, counterparty problems, changing perpetual-futures funding, borrowing expenses, model breakdowns, and technology failures can erase an apparent advantage. Arbitrage and pairs trading require advanced analytical, execution, and operational controls.
12. Grid trading
How it works: Grid trading places staggered buy and sell orders at predetermined price intervals. A spot grid operating within an illustrative $90–$110 range attempts to capture repeated fluctuations. It is a structured form of range trading, not a source of guaranteed returns.
Automation: Trading software maintains orders and adjusts inventory while markets remain open. Automation improves consistency and reduces manual work; it cannot fix a strategy with poor assumptions. Grid configurations still require supervision, exposure limits, and clear rules for stopping when market conditions change.
Key risks: A sustained decline can leave a grid accumulating a depreciating asset. A sharp rally can exhaust sellable inventory and limit participation in further gains. Many profitable individual orders do not guarantee a rise in total account value. Futures grids add liquidation, leverage, and funding exposure.
Which crypto trading strategy is best for your situation?
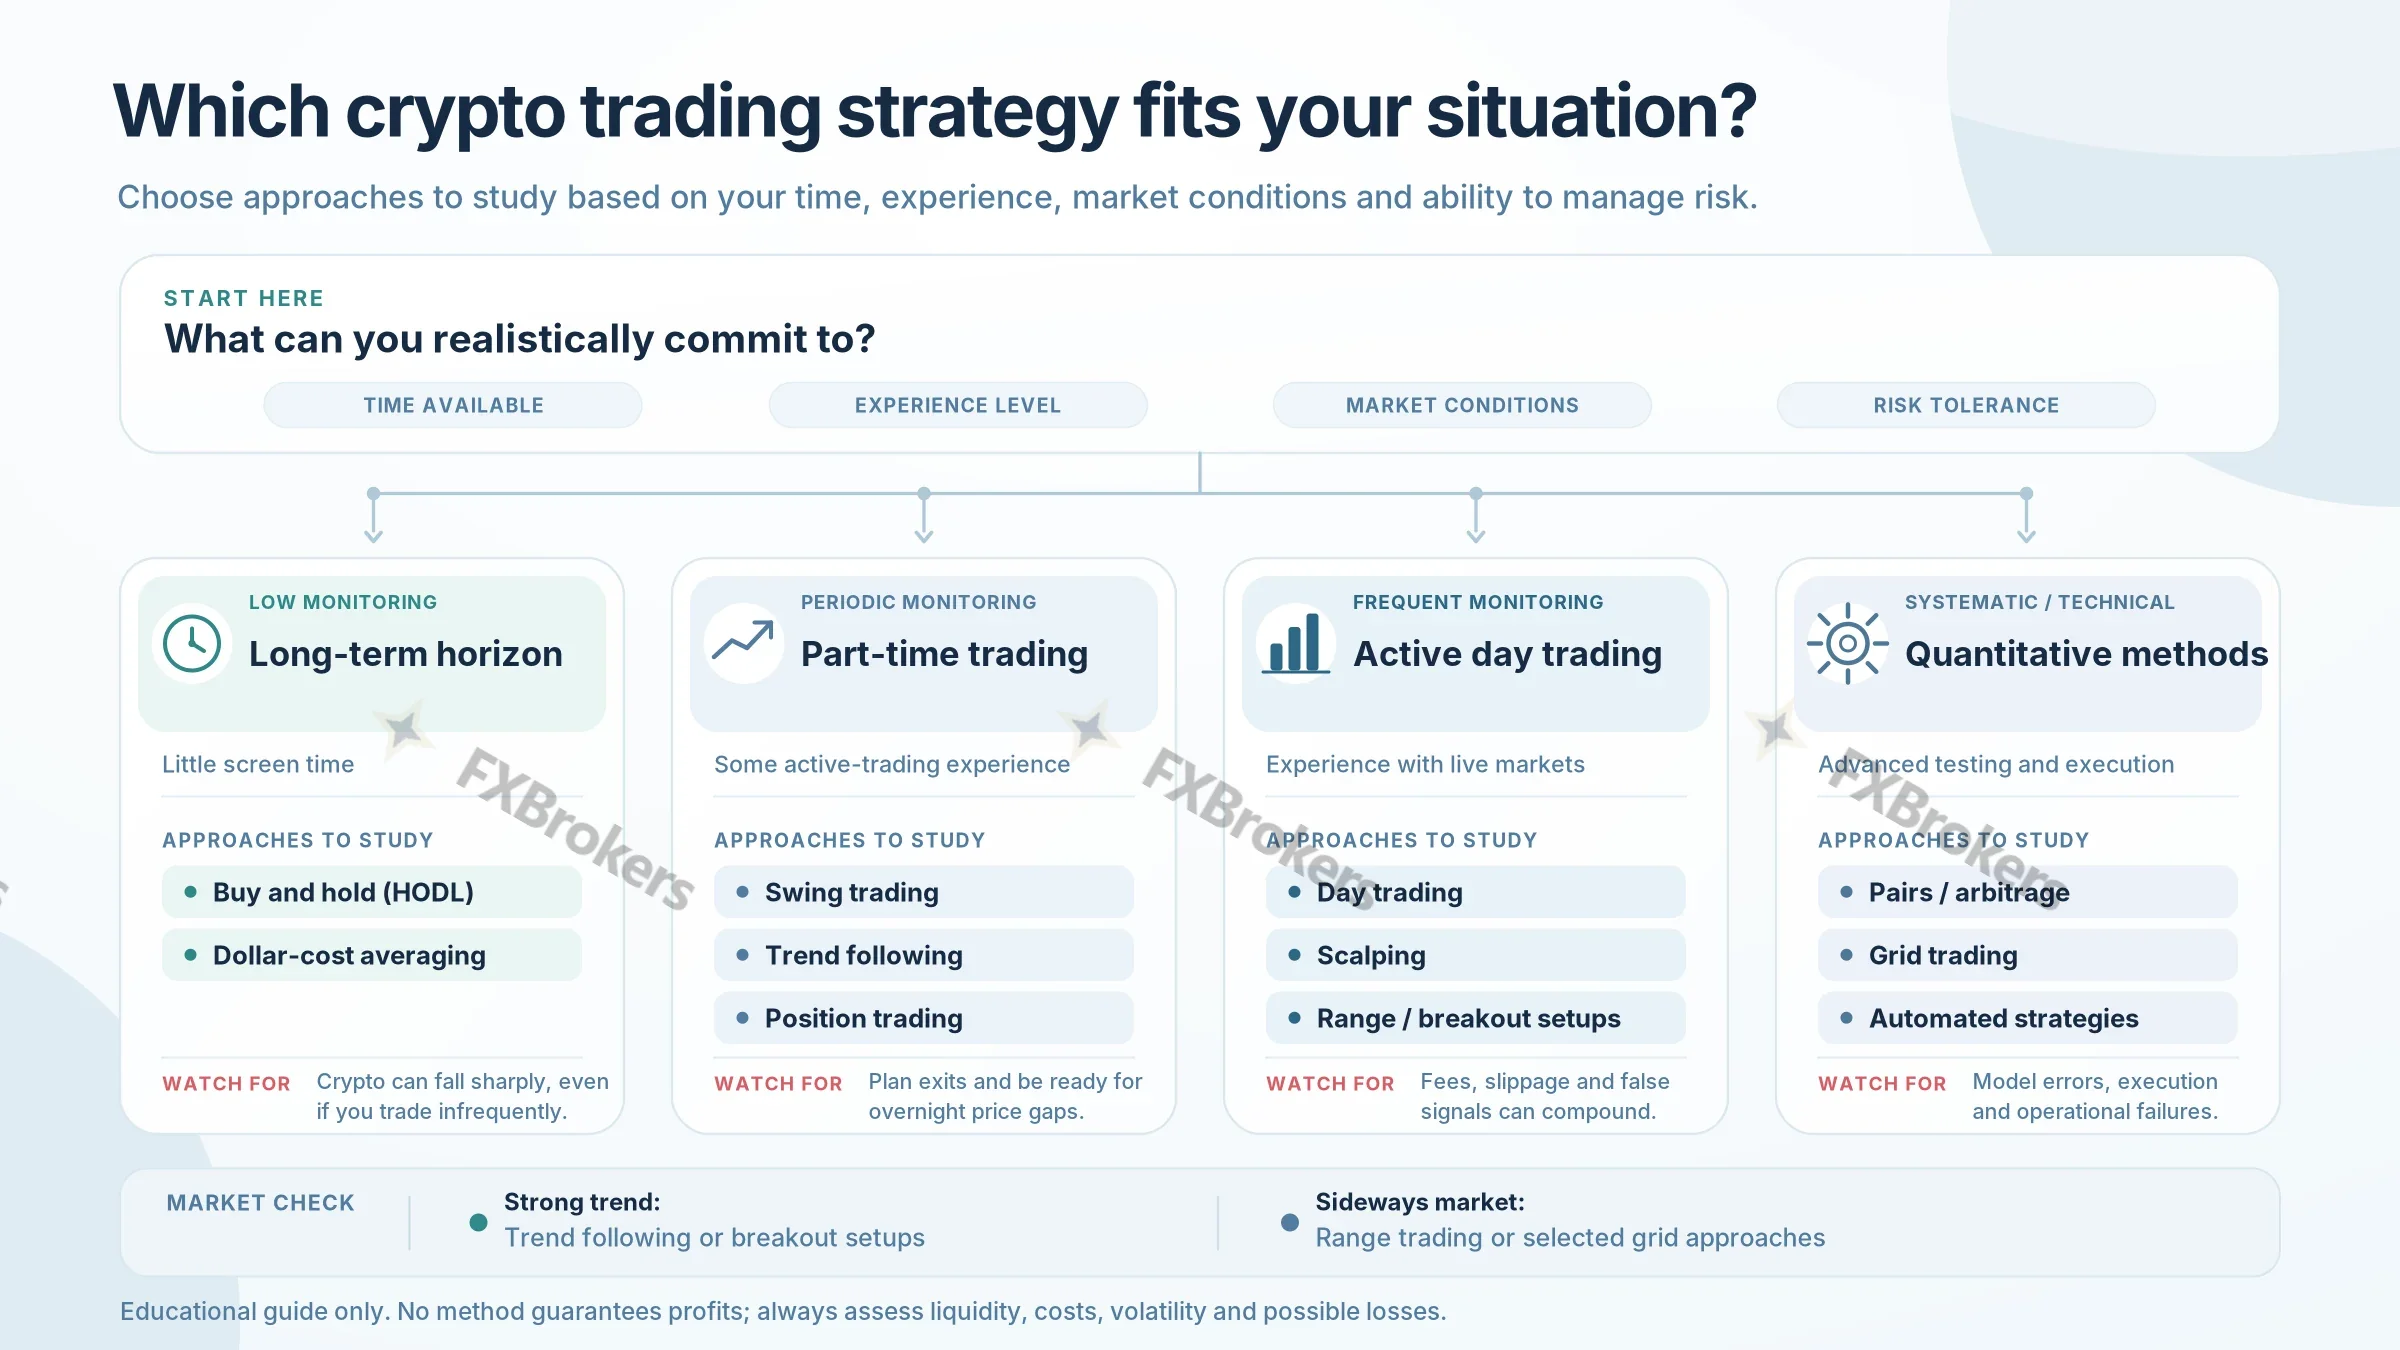
The right strategy depends on the trader's objectives and constraints. The most useful approach has clear rules, manageable exposure, realistic monitoring demands, and results that hold up after transaction costs. The comparison below identifies sensible methods to investigate under different conditions; it is not a personalized recommendation.
| Situation | Approaches to study | Questions to ask first |
|---|---|---|
| Long horizon; little screen time | DCA, buy and hold | Can you tolerate a deep loss and secure your assets? |
| Part-time active trader | Swing, trend, position trading | Can you monitor open positions and follow exits? |
| Strong trend in a liquid market | Trend following, breakout | Where is the signal invalidated and how late is the entry? |
| Sideways, liquid market | Range, selected grid approaches | What happens if price leaves the range? |
| Experienced intraday trader | Day trading, scalping | Do results remain viable after fees and slippage? |
| Quantitative or technical specialist | Pairs trading, execution-based arbitrage | Can you validate the model and complete both legs reliably? |
A simple method can produce severe losses, while a sophisticated algorithm can fail despite its complexity. Evaluate experience level in terms of the skills required to execute and control a strategy—not as a shortcut to estimating its returns.
How to build and test a crypto trading plan
A trading plan belongs on paper before the first order is placed. The following seven elements separate a repeatable method from an unsupported opinion about where price will move.
- Choose the market: specify the asset pair, venue, and whether the trade uses spot assets or derivatives.
- Set the timeframe: decide which chart and trading session the signals refer to.
- Write the entry rule: define observable conditions, not vague instructions such as “buy when it looks strong.”
- Define invalidation: identify the price level or market condition that shows the thesis is no longer valid.
- Calculate exposure: determine a position size from the planned loss, available capital, and realistic transaction costs.
- Plan every exit: include loss exits, profit-taking, time-based exits, and what to do if liquidity deteriorates.
- Record the outcome: log the planned setup, actual fills, fees, errors, and reasoning so that results can be reviewed consistently.
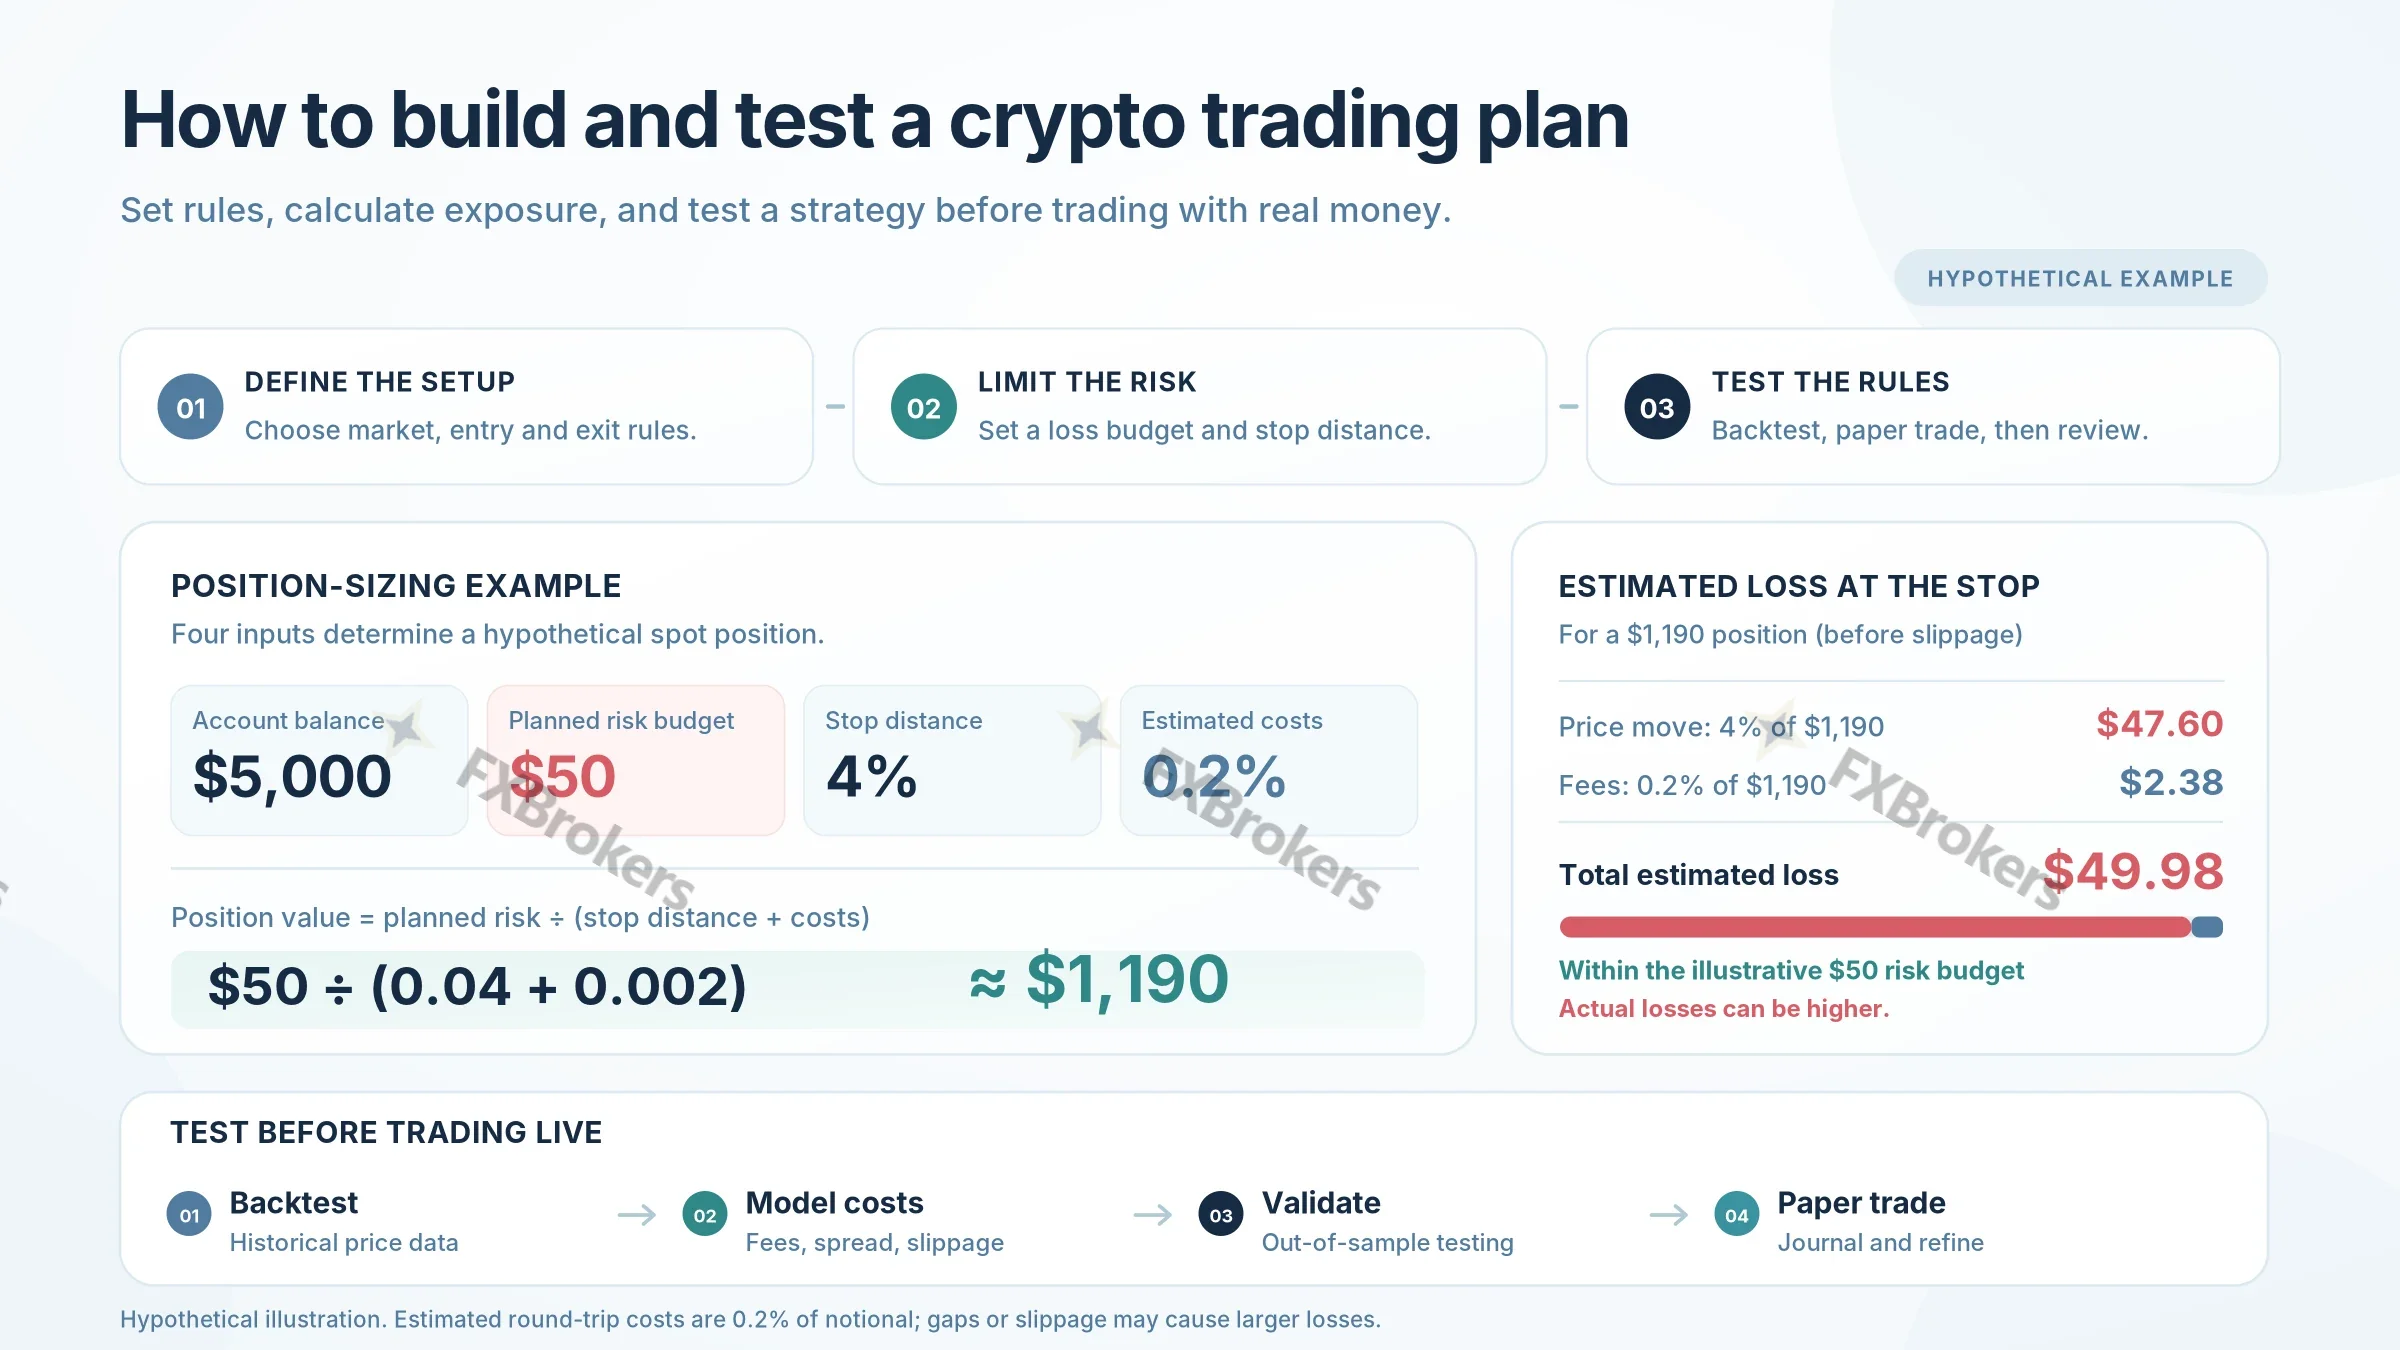
Worked example: calculating position size from a loss budget
Consider a hypothetical spot account worth $5,000. The trader allocates a planned loss budget of 1% of account value, or $50, to one trade. The entry price is 4% above the intended stop level, and estimated round-trip fees equal 0.2% of the position's notional value.
Approximate position size = planned loss budget ÷ (distance to stop + estimated round-trip fee rate).
$50 ÷ (0.04 + 0.002) ≈ $1,190.48
At approximately $1,190 in exposure, a 4% adverse move represents about $47.60. The simplified 0.2% allowance adds roughly $2.38 in fees, putting the modelled loss close to $50. This calculation is an estimate, not a hard loss ceiling. Actual fees depend on execution, and price gaps, slippage, order mechanics, inadequate liquidity, and financing charges can push losses above the planned budget.
The 1% figure is an example, not a universal position-sizing standard. Trading capital must remain separate from funds needed for rent, bills, emergencies, or other essential commitments.
Backtesting versus paper trading
Backtesting applies a defined strategy to historical market data. A useful test models signal timing, order execution, bid-ask spreads, commissions, slippage, and any funding or carrying costs. It also examines different regimes, including trending, volatile, and range-bound periods.
Use one data sample to develop the rules and a later, independent out-of-sample sample to evaluate them. Eliminate look-ahead bias by ensuring the model uses only information available at each historical decision point. Guard against overfitting: optimizing a system to explain past prices can produce an impressive backtest with little forward value.
Paper trading tests the same rules against incoming market data without committing funds. It reveals procedural weaknesses, gaps in discipline, and problems with order selection. Simulated trades often receive better fills than live orders, so test results must be interpreted with that limitation. Historical and forward tests establish evidence about a method under particular conditions; they do not guarantee future performance.
Trading indicators, order types, and bots
How to read indicators without mistaking them for strategies
Simple moving averages (SMA) calculate the average price over a defined lookback period. Exponential moving averages (EMA) assign greater weight to recent observations. Comparing averages helps describe trend direction, but both indicators follow price and can lag important reversals.
Relative strength index (RSI) measures recent momentum on a bounded scale. Readings above 70 or below 30 are common reference points rather than automatic instructions to sell or buy. Strong trends can sustain extreme readings for extended periods.
Moving average convergence divergence (MACD) uses relationships among moving averages to assess momentum. Volume and order-book depth show aspects of participation and available liquidity. These inputs support trade analysis, but none independently determines entry, exit, exposure, and risk. A strategy must connect indicators to explicit decisions.
Choosing an order type
- Market order: attempts immediate execution against available orders. It prioritizes speed, not a guaranteed fill price.
- Limit order: specifies the worst acceptable execution price but may remain unfilled.
- Stop-market order: when supported, triggers a market order at a stop condition; the eventual fill can differ significantly from the stop level.
- Stop-limit order: triggers a limit order, which controls acceptable price but may not execute during a sharp move.
- Take-profit / bracket instructions: may help automate planned exits, but availability and behavior vary by exchange and product.
Understand the exact order behavior supported by the chosen exchange before relying on it. Market, limit, stop-market, and stop-limit instructions involve different trade-offs between execution certainty and price control, particularly during sharp price moves.
Can crypto trading bots improve a strategy?
A trading bot executes programmed instructions consistently and monitors markets without continuous human attention. It has no independent ability to establish whether those instructions are profitable. Grid bots, scheduled purchases, and rebalancing tools can all automate a flawed approach. Test the logic, restrict API permissions, secure the account, and review fills, failures, exposure, and changing market conditions. Guaranteed-return claims are a serious warning sign.
Spot crypto trading vs. leveraged futures
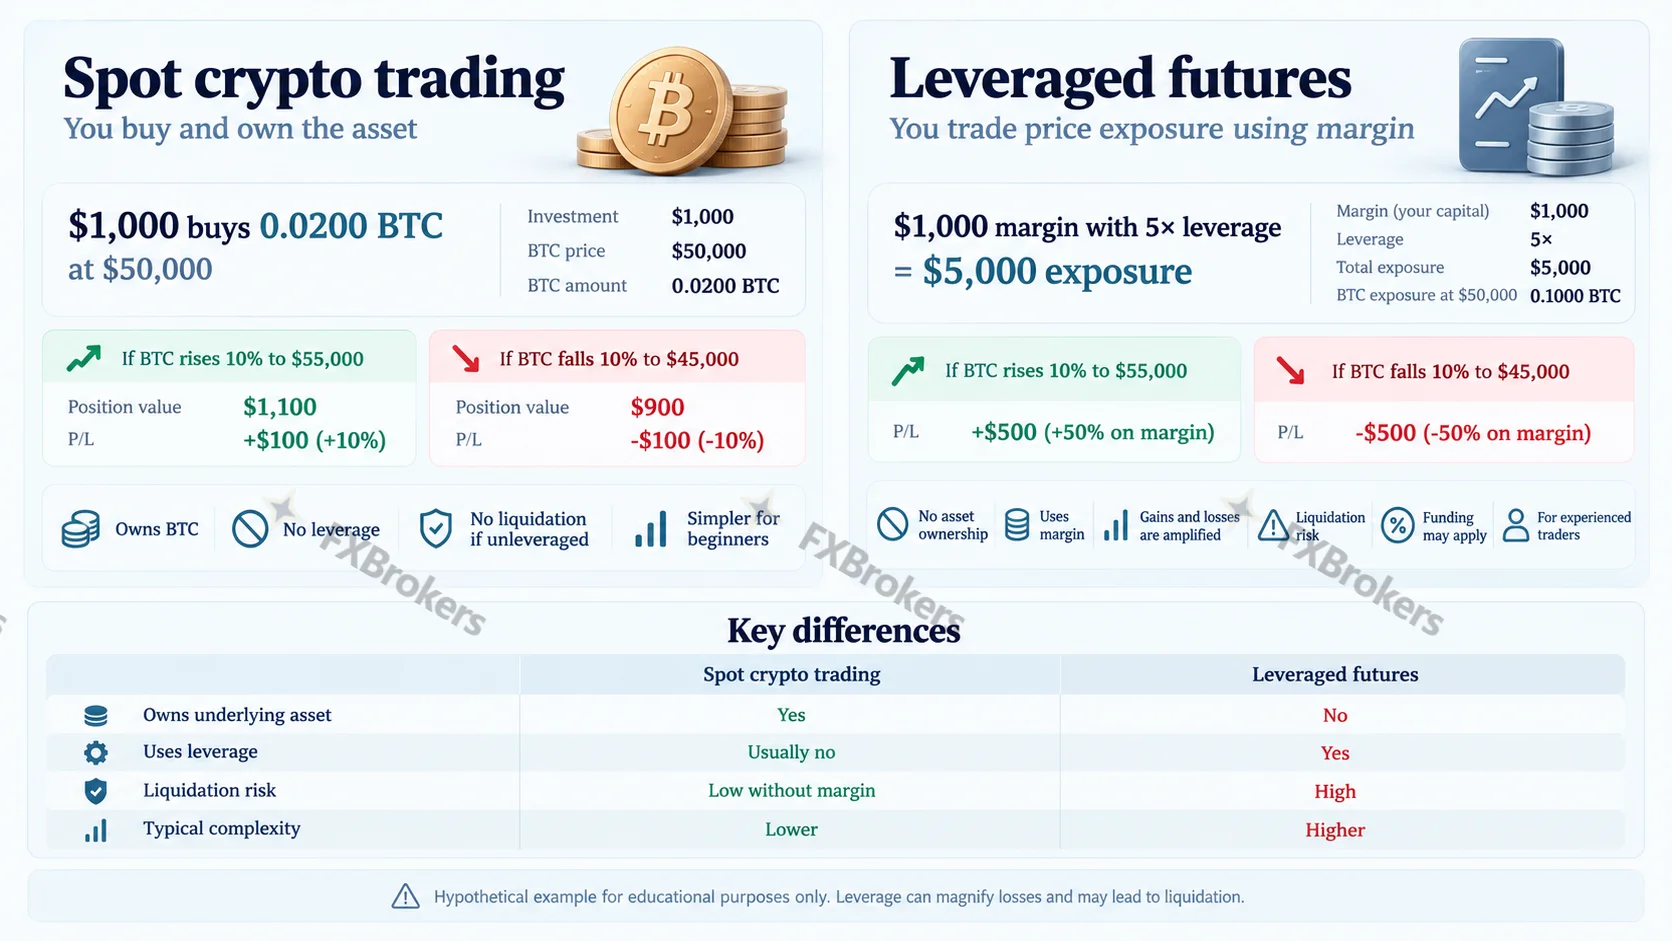
Spot trading involves buying or selling the underlying cryptoasset for settlement under the exchange's rules. Spot positions carry market, custody, and platform risk. Futures and perpetual contracts provide derivative exposure instead of equivalent outright ownership; their margin terms, contract specifications, and availability differ across products and jurisdictions.
Leverage magnifies both gains and losses. With simplified 5× exposure, a 10% adverse price movement corresponds to a loss of roughly 50% of initial margin before fees or funding, provided the position has not already been liquidated. Maintenance-margin requirements can trigger forced liquidation earlier. Depending on the contract, a trader can lose the margin committed and face additional obligations.
Perpetual futures use funding payments between long and short positions under rules set by the contract and venue. Funding can be a cost or a receipt, and its rate can change rapidly. Settlement schedules also vary. Derivatives access depends on jurisdiction, so availability in one market does not imply that a product is offered to U.S. retail traders.
A basic spot-trading simulation introduces fewer moving parts than a leveraged futures account. It therefore offers a clearer environment for learning order behavior, exposure limits, and recordkeeping. That practical advantage does not make spot cryptoassets safe.
Crypto trading risk management: what can go wrong?
Every complete strategy defines what can go wrong. The main sources of failure frequently occur together:
- Market risk: unexpected price declines, long drawdowns, or permanent impairment of an asset.
- Liquidity and slippage: a quoted price may not be executable for the desired quantity, especially during volatility.
- Transaction costs: commissions, spreads, network fees, financing, and funding can erase a theoretical edge.
- Leverage and liquidation: derivatives can close positions involuntarily before the original thesis has time to develop.
- Exchange and counterparty risk: outages, insolvency, withdrawal restrictions, or a compromised account can interrupt access to assets.
- Custody risk: lost keys, malicious signatures, phishing, or an incorrect address can cause irreversible losses.
- Fraud and manipulation: impersonation, fake trading platforms, pump-and-dump schemes, and promised returns are warning signs.
- Behavioral risk: revenge trading, moving stops to avoid admitting a loss, and increasing position sizes after a losing streak.
Keep essential savings separate from trading capital, understand the full terms of every product, and judge performance on more than a historical win rate. Cryptoassets can experience extreme losses, and security failures can permanently remove access to holdings. Trading discipline must include custody, counterparty, and operational safeguards.
A useful trading journal records the intended setup, actual entry and exit prices, transaction costs, drawdowns, deviations from the rules, and execution problems. Review these records to distinguish weaknesses in the strategy from mistakes in implementation. A win rate on its own gives an incomplete picture of performance.
Crypto trading taxes and regulations: U.S. rules and a UK note
United States
For U.S. federal tax purposes, digital assets are generally treated as property. Selling crypto for dollars, exchanging one token for another, or spending crypto on goods and services can give rise to reportable transactions and taxable gains or losses. Purchasing and continuing to hold an asset is not the same event as disposing of it.
Maintain transaction records showing dates, quantities, dollar values, proceeds, cost basis, and associated fees. The applicable tax treatment depends on the nature of the transaction, classification of the asset, and holding period. Exchange reports assist with documentation, but the taxpayer remains responsible for accurate reporting. State tax rules and derivatives transactions can create additional obligations.
United Kingdom: the “30-day rule” is jurisdiction-specific
UK cryptoasset taxation uses specific identification and matching rules, including rules for buying the same token within 30 days after a disposal. These are tax rules, not general principles of trading strategy, and they should not be applied to U.S. taxpayers. UK investors also face the possibility of losing the full value of a crypto investment.
Tax treatment depends on jurisdiction, transaction structure, and individual circumstances, and the rules change over time. Complex activity involving derivatives, decentralized finance, or multiple countries warrants professional tax advice.
How to put a crypto trading strategy into practice
The strongest starting point is a strategy whose assumptions, decisions, costs, and potential losses are fully understood. First separate investing from active trading. Then select one method, document the entry and exit rules, model realistic costs, and test the plan on historical and incoming data before considering live execution.
A trading plan does not eliminate uncertainty. It makes decisions measurable, exposes weaknesses before capital is at risk, and establishes clear conditions for standing aside. In volatile markets, knowing when not to trade is part of the strategy.
FAQs
Are trading bots more profitable than manual trading?
Not automatically. Bots can reduce repetitive work and enforce rules, but they execute poor strategies just as faithfully as good ones. Compare performance after costs, assess security permissions, and define how the system responds when market conditions change.
Can RSI or moving averages predict crypto prices?
No. RSI and moving averages summarize historical market behavior; they cannot reliably forecast the next price move in isolation. Their value lies in contributing measurable conditions to a complete, tested decision framework.
How much money do you need to start crypto trading?
There is no universally appropriate starting balance. Exchange minimums, fees, and market conditions differ, and even a small account can be wiped out. Historical testing and paper trading allow traders to develop a process without financial exposure. Essential savings and borrowed money should not be treated as trading capital.
Is swing trading better than day trading for beginners?
Swing trading involves fewer intraday decisions and is often easier to combine with other commitments. Its trade-off is exposure to price moves overnight and on weekends. Day trading requires closer monitoring and can incur more transaction costs. Neither approach is inherently safer or more profitable.
What is the 30-day rule in crypto?
In a UK tax context, the “30-day rule” commonly refers to matching certain reacquisitions of the same cryptoasset after a disposal. It is not a technical trading signal, and it does not apply universally across countries. U.S. taxpayers must follow the rules relevant to their own jurisdiction.
What is the 3-5-7 rule in crypto trading?
The “3-5-7 rule” has no single standardized meaning in crypto trading. One version uses 3% of capital for an individual position, 5% for total exposure, and 7% as a target gain on a winning trade. These figures are conventions, not validated performance rules. Crucially, the amount allocated to a trade is not the same as the amount that stands to be lost.
Can you make $100 a day trading crypto?
A trader can earn $100 on one day, lose $100 on another, and experience much larger setbacks. Crypto markets do not provide a dependable fixed daily income. Claims of effortless or guaranteed daily gains are incompatible with the risks of active trading.
What is the most profitable cryptocurrency trading strategy?
No strategy is consistently the most profitable across all cryptoassets and market regimes. A credible profitability assessment includes a defined period, representative data, realistic costs, independent test results, and the depth of losses along the way. A high win rate or isolated success story proves very little.
What is the best crypto trading strategy for beginners?
Beginners benefit most from methods they can understand and test without making rapid decisions. DCA, long-term holding, and simulated unleveraged swing trading offer different ways to study risk, execution, and market behavior. The priority is mastering security, order mechanics, and loss control before pursuing frequent trades.